Accessing Analytics
Click Analytics in the sidebar to open the dashboard. By default, it shows the last 30 days of activity.Event Types
Every email generates events as it moves through the delivery pipeline and recipients interact with it:| Event | What it means |
|---|---|
| Sent | The email was accepted by the recipient’s mail server |
| Delivered | The email reached the recipient’s inbox |
| Opened | The recipient opened the email |
| Clicked | The recipient clicked a link in the email |
| Bounced | The email couldn’t be delivered (hard or soft bounce) |
| Complained | The recipient marked the email as spam |
| Unsubscribed | The recipient opted out via the unsubscribe link |
Filtering and Time Ranges
Use the time range selector in the top-right corner to adjust the window:- 1h - last hour (useful for monitoring a send in progress)
- 24h - last day
- 7d - last week
- 30d - last month (default)
- 1y - last year
- Recipient email - search for a specific contact to see all their events
- Email - filter events for a specific campaign or automation
- Event type - toggle which event types appear on the chart
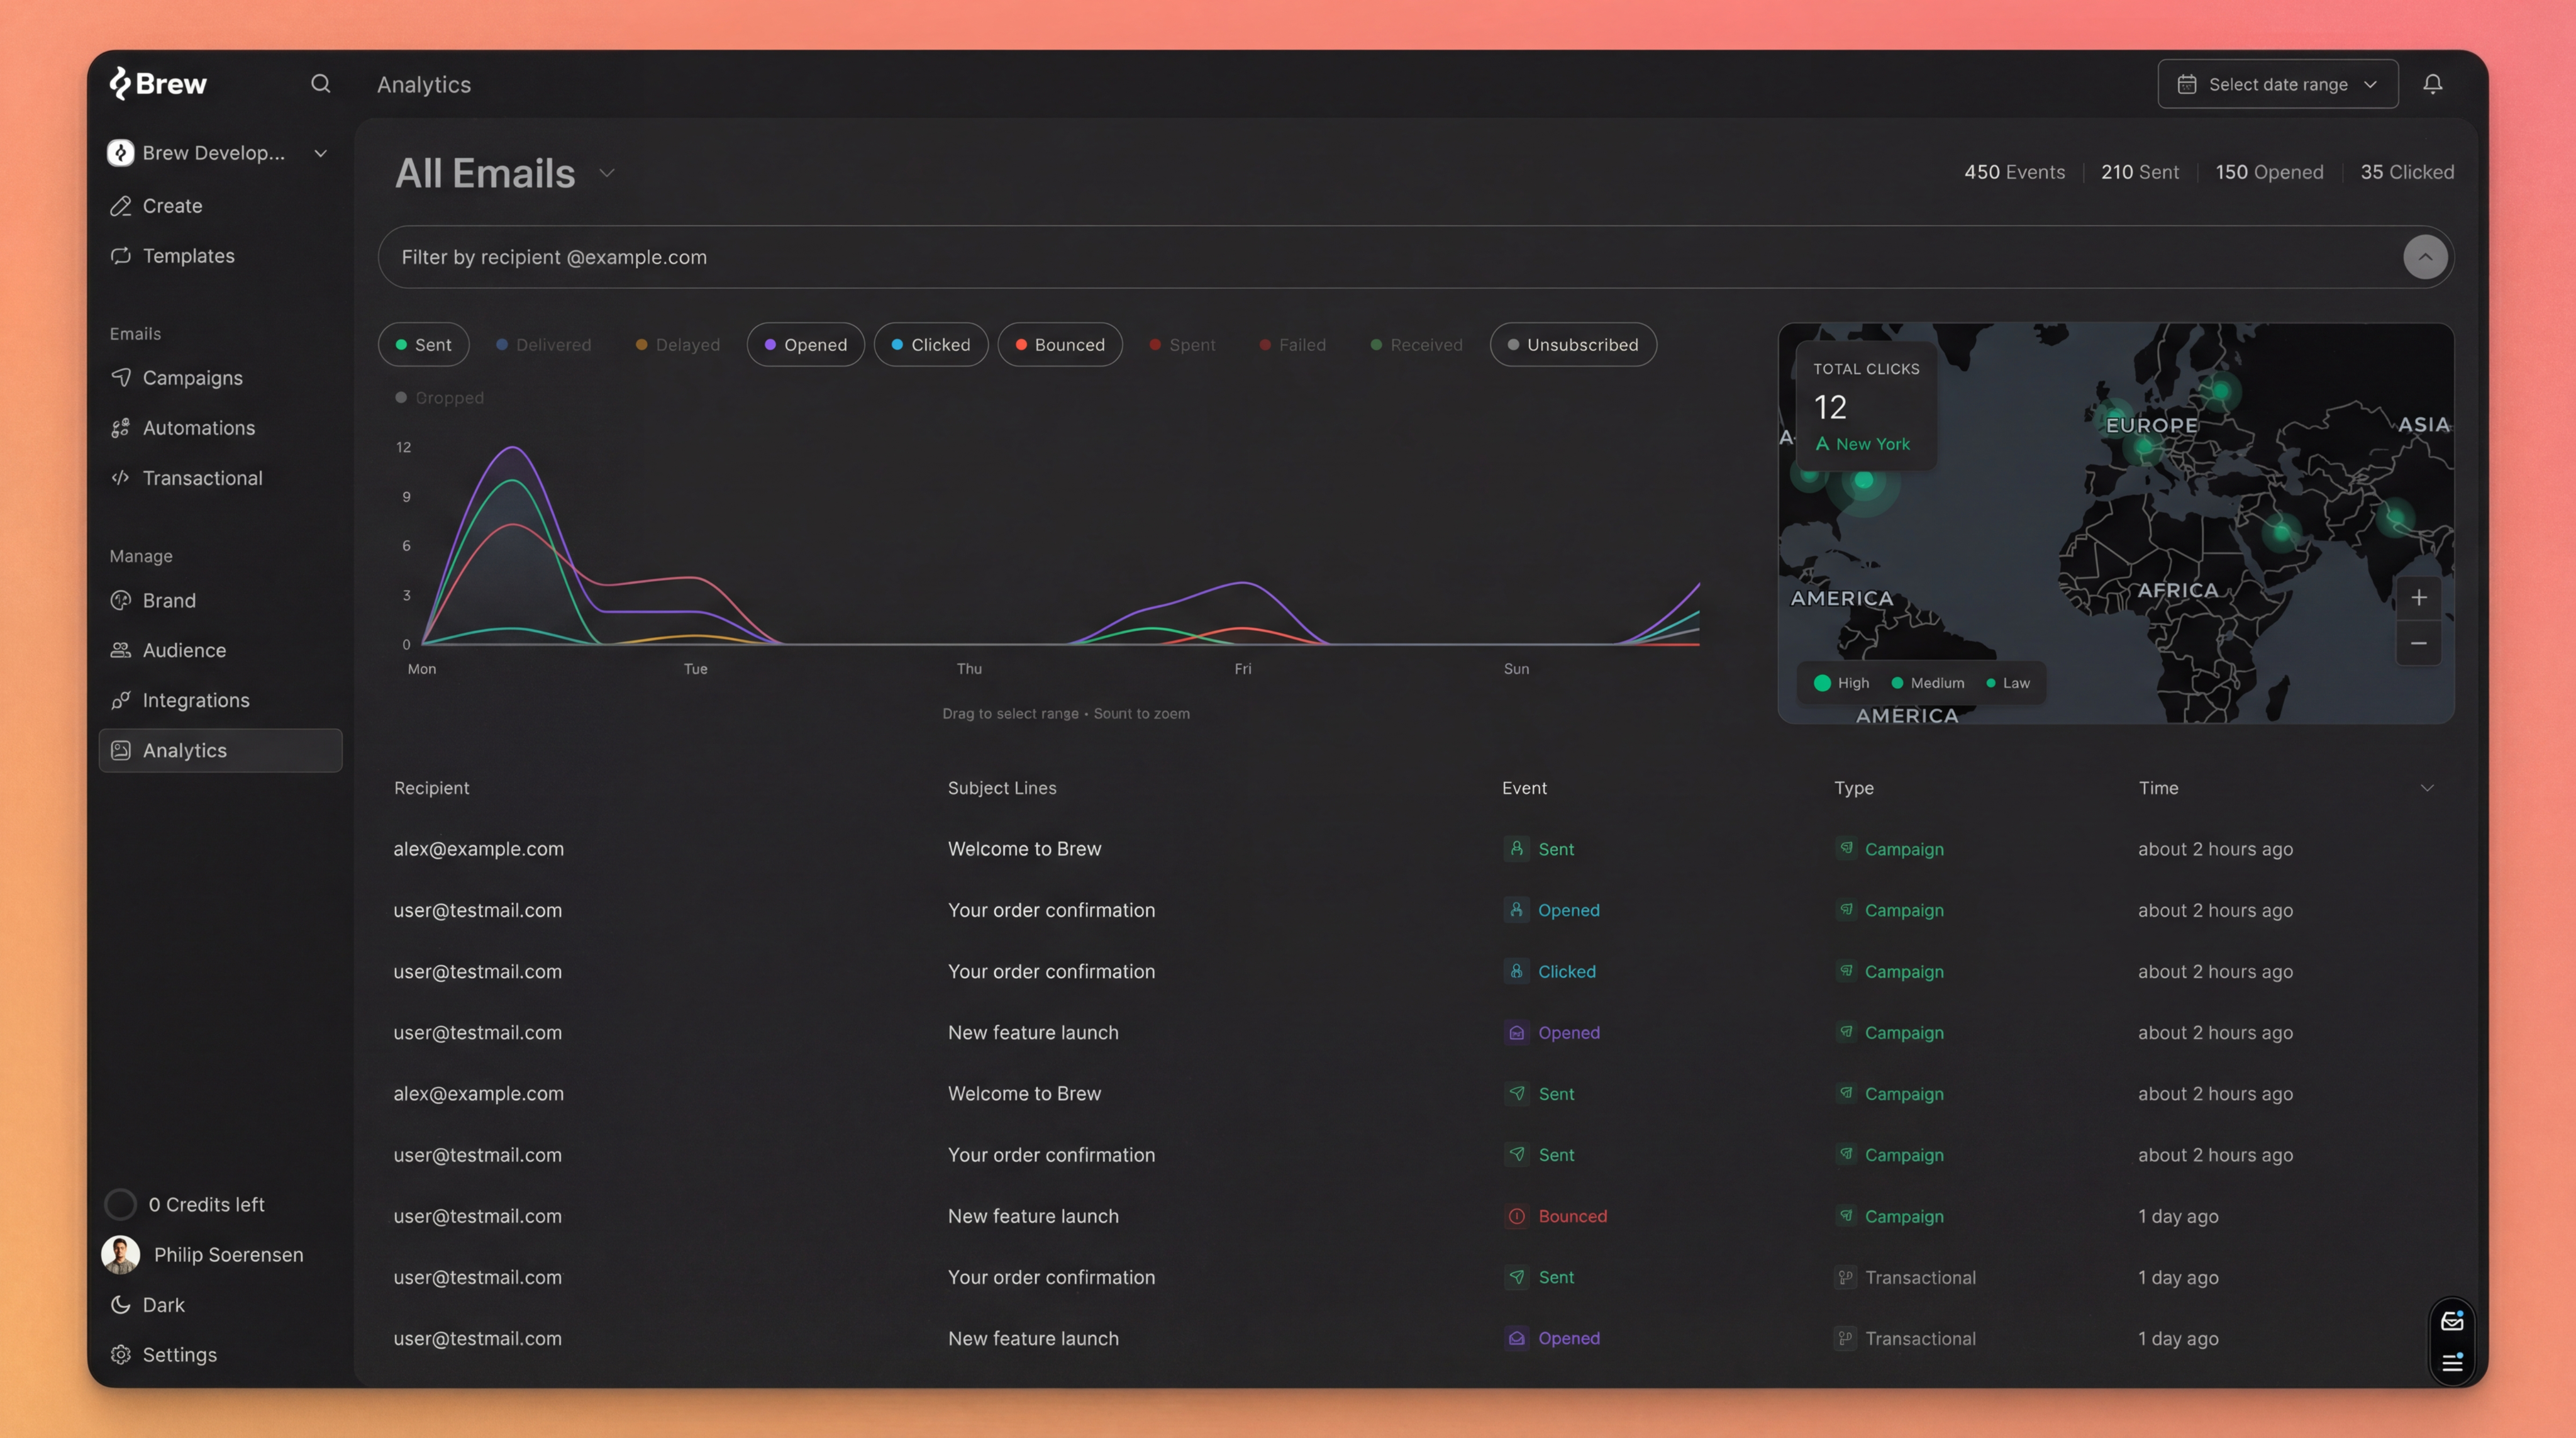
The Activity Chart
The chart at the top of the dashboard shows event volume over time. Each event type has its own colored line. Click the event type labels below the chart to show or hide specific types. You can drag on the chart to zoom into a specific time range, or scroll to zoom in and out.Event Details
Click any event in the table below the chart to see full details:- Recipient email address
- Event timestamp
- Email subject line
- Email client and operating system (when available)
- Geographic location (when available)
Geographic Data
The analytics dashboard includes a map showing where your recipients are opening and clicking emails. This helps you understand your audience’s geographic distribution and optimize send times for different regions.Need Help?
Our team is ready to support you at every step of your journey with Brew. Choose the option that works best for you:- Self-Service Tools
- Talk to Our Team
Search Documentation
Type in the “Ask any question” search bar at the top left to instantly find relevant documentation pages.
ChatGPT/Claude Integration
Click “Open in ChatGPT” at the top right of any page to analyze documentation with ChatGPT or Claude for deeper insights.